Why Insurance Professionals Need a Consolidated Customer View
Customer information is often spread across different processes and records. As portfolios grow, it becomes increasingly difficult to answer questions such as:
-How loyal is this customer?
-Which products generate the highest premium value?
-Are there outstanding receipts that require attention?
-How has the customer’s portfolio evolved over time?
-Are there signs of dissatisfaction or increased risk?
Without a consolidated view, answering these questions often requires navigating multiple screens, reports, or systems. The Policy Holder Dashboard brings this information together in a single analytical workspace.
What Is the Policy Holder Dashboard?
The Policy Holder Dashboard provides a consolidated analytical view of a customer’s relationship with the organization. Designed for both individual and corporate customers, it brings together information across:
-Policies
-Proposals
-Receipts
-Refunds
-Claims
-Customer lifecycle events
By centralizing these elements, users can quickly understand the customer’s history, current situation, and relevant trends.
The goal is simple: enable faster, more informed decisions through accessible and actionable data.
Key Insights Available in the Policy Holder Dashboard
Customer Event Timeline
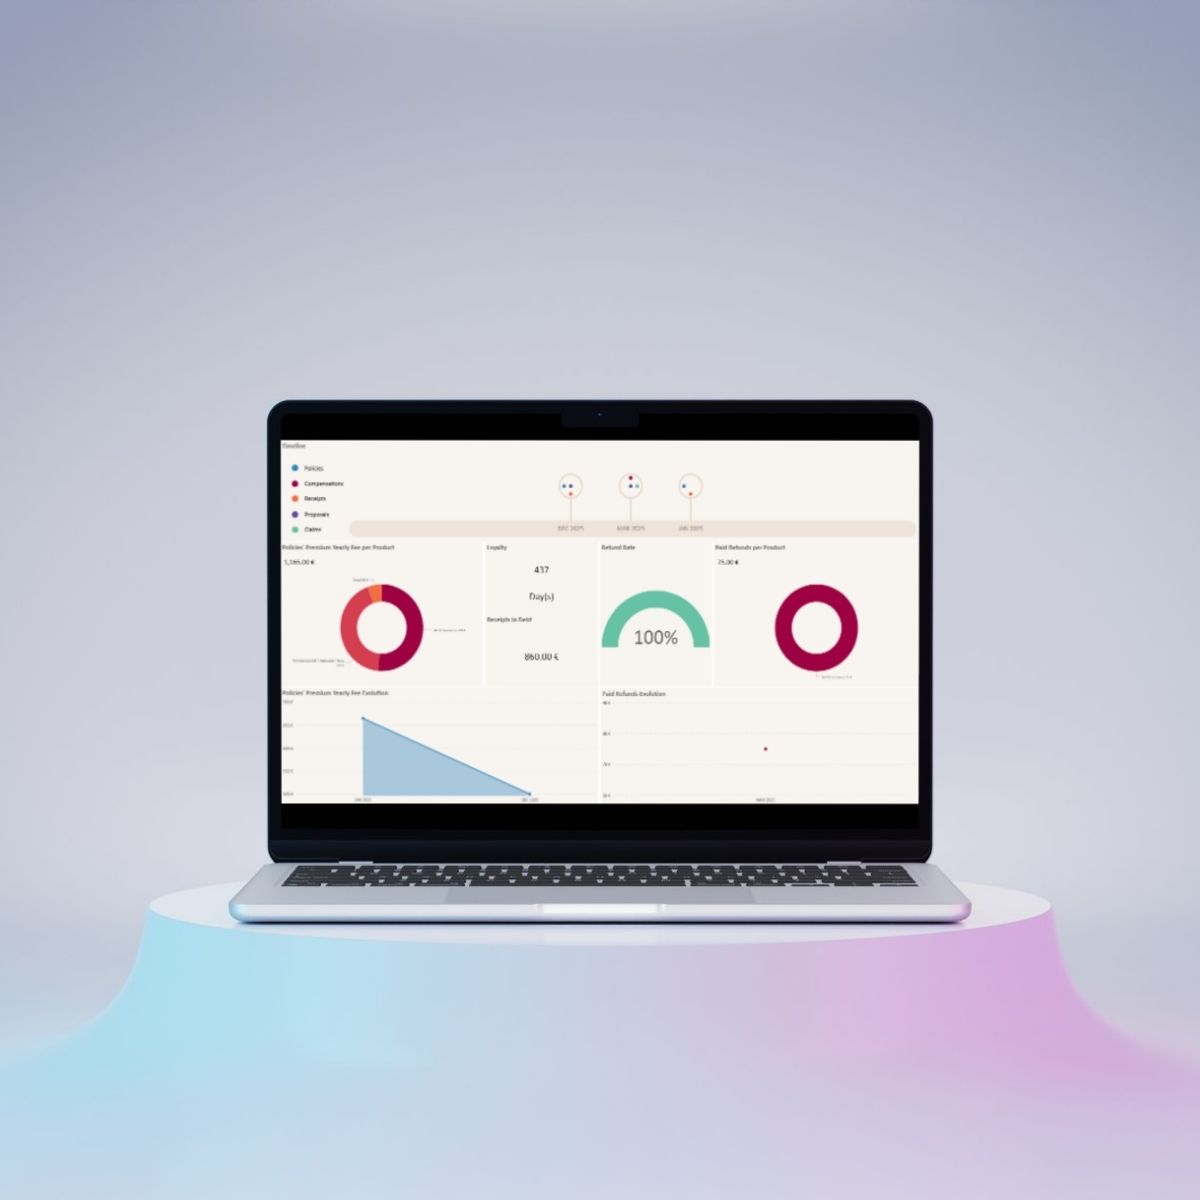
Understanding a customer often requires understanding their history. The timeline provides a chronological view of relevant events, including policies, proposals, claims, receipts, and refunds. This makes it easier to identify patterns and understand the context behind current customer activity.
Annual Premium Distribution by Product
A visual breakdown of premium values by product helps users understand portfolio composition at a glance. This information can support cross-selling opportunities, portfolio reviews, and product concentration analysis.
Loyalty Indicator
Customer retention remains one of the most important considerations in insurance. The Loyalty KPI measures the number of consecutive days a customer has maintained active policies, providing valuable context during renewal and retention discussions.
Outstanding Receipts
The dashboard highlights receipts that remain unpaid, helping teams identify situations that may require operational or commercial follow-up.
Refund Analysis
Refund information is presented through dedicated indicators that help users understand the overall refund rate, paid refunds by product, and refund evolution over time. This creates additional visibility into customer activity and service-related processes.
Premium Evolution
Rather than looking at premium values in isolation, users can analyze how premiums evolve over time. This helps identify growth, reduction, or changes in portfolio composition.
New Behavioral KPIs: Deeper Customer Insights
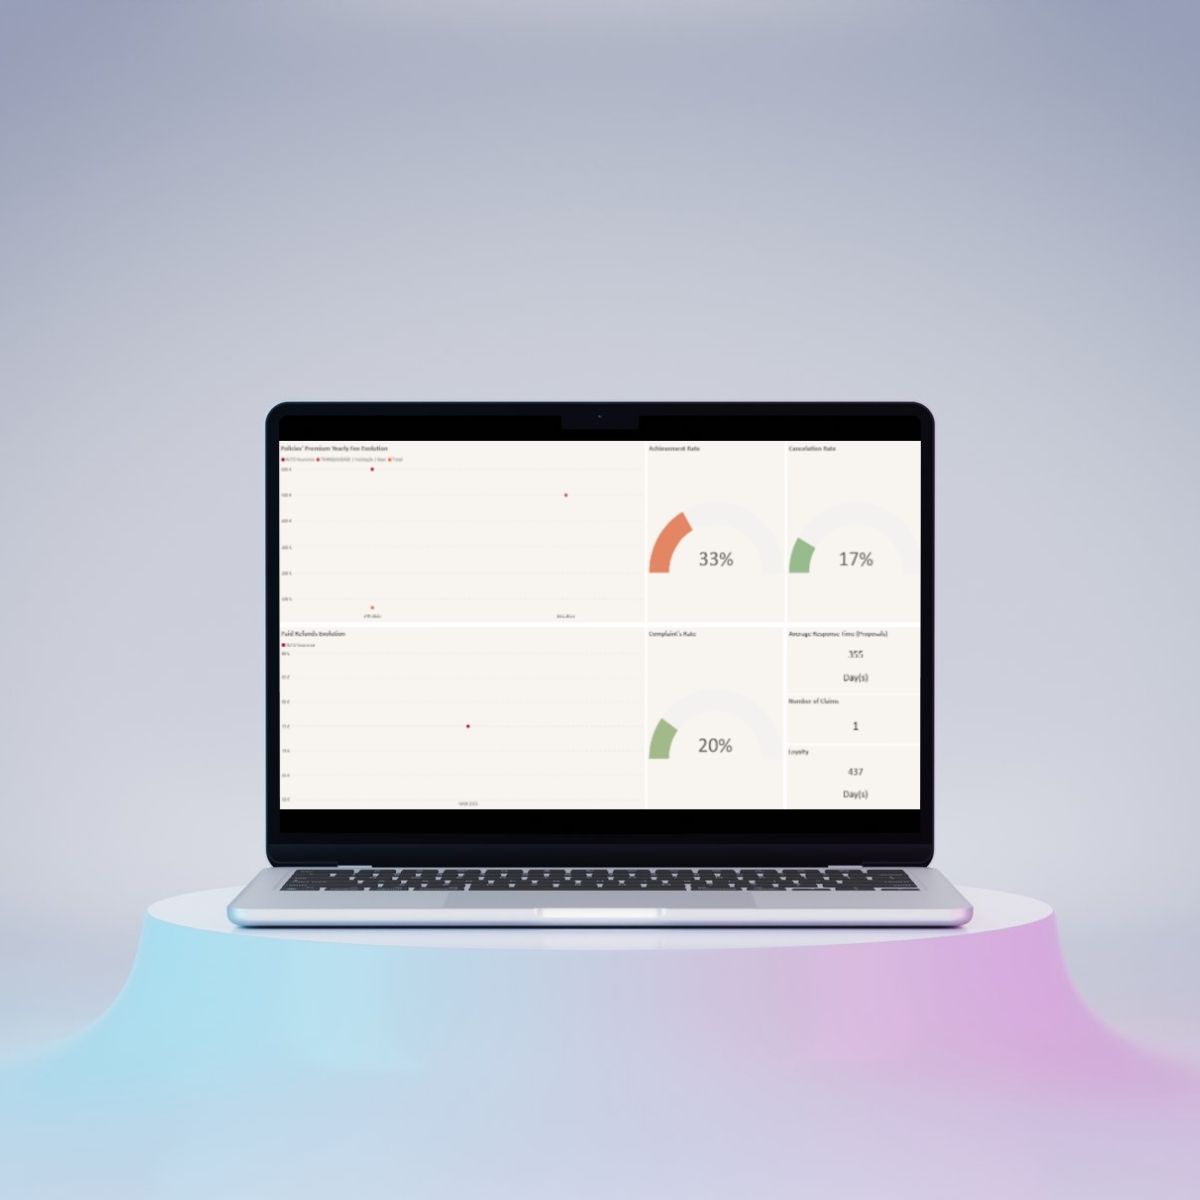
One of the latest enhancements to the Policy Holder Dashboard is a dedicated KPI section focused on customer behavior and operational performance. These indicators help users move beyond operational data and gain a more strategic understanding of customer relationships.
Achievement Rate
Measures the percentage of proposals that are successfully converted into policies. This KPI helps provide context on commercial effectiveness and customer engagement.
Cancellation Rate
Provides visibility into policy cancellation activity, helping teams identify potential retention challenges.
Complaint Rate
Allows organizations to track complaint-related activity and proactively investigate customer experience issues.
Average Response Time
Measures the average time required to respond to proposals. This KPI can support process optimization and service improvement initiatives.
Number of Claims
Provides a consolidated view of claim activity associated with the customer.
Contextual Loyalty
Combines customer longevity with behavioral indicators to provide additional relationship context.
From Data to Action
Data becomes truly valuable when it supports action. Consider a portfolio manager preparing for a renewal discussion. With the Policy Holder Dashboard, they can review:
- Loyalty history
- Premium evolution
- Claims activity
- Outstanding receipts
- Recent complaints
- Customer timeline events
Without searching through multiple systems, the manager can quickly gain the context needed for a more informed conversation. Similarly, commercial managers can analyze conversion rates, response times, and cancellation trends to identify opportunities for improvement across their portfolios.
Built on Power BI for Interactive Analysis
The Policy Holder Dashboard uses Microsoft Power BI capabilities to provide a dynamic analytical experience. Depending on the report configuration and the organization’s access model, users can benefit from:
- Interactive filtering
- Cross-highlighting
- Drill-through navigation
- Responsive visualizations
- Secure role-based access
These capabilities make it easier to move from high-level metrics to detailed analysis whenever further investigation is required.
Supporting Smarter Insurance Decisions
Insurance professionals are expected to manage increasing volumes of information while maintaining high levels of customer service. The Policy Holder Dashboard helps address this challenge by consolidating critical customer information and presenting it through meaningful KPIs and visual analytics.
Rather than spending time gathering data, users can focus on understanding trends, prioritizing actions, and strengthening customer relationships. The result is a more informed, proactive, and data-driven approach to customer portfolio management.
Looking for a better way to understand your customers and manage your insurance portfolio?
Discover how the Policy Holder Dashboard in myCRM for Insurance helps insurance professionals transform customer data into actionable insights and more informed decisions.
Request a demo today and explore the potential of customer analytics in insurance.
MORE ARTICLES
Check out all our articles