

Why Comparing Insurance Intermediaries Matters
Managing a network of intermediaries requires more than simply tracking production figures.
Business leaders need answers to critical questions such as:
-Which intermediaries contribute the highest premium volumes?
-Where are the strongest growth opportunities?
-Which partnerships generate the greatest commercial value?
-How does claims performance vary across channels?
-Which intermediaries require closer attention or strategic support?
Without a clear and consolidated view of performance, insurers risk missing opportunities, delaying decision-making, and investing resources in the wrong areas.
Access to reliable data is no longer a competitive advantage. It is a business necessity.
Introducing the Intermediary Comparison Dashboard

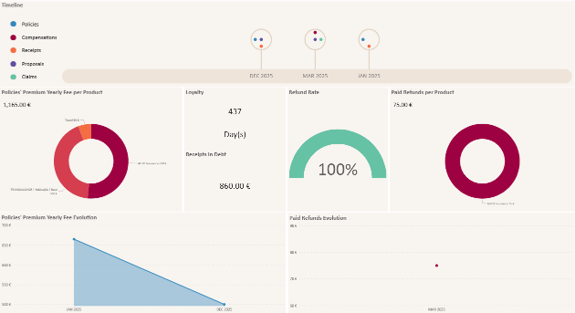
The Intermediary Comparison Dashboard provides a centralized analytical workspace within myCRM for Insurance, enabling users to compare multiple intermediaries side by side through intuitive and interactive visualizations.
Powered by Microsoft Power BI, the dashboard delivers a holistic view of commercial and operational performance while allowing users to explore data from multiple perspectives.
With dynamic filtering, drill-down capabilities, and real-time interactions between visuals, decision-makers can quickly uncover trends, identify performance gaps, and develop more effective growth strategies.
Key Performance Indicators at a Glance
The dashboard brings together the most relevant intermediary performance metrics into a single view.
Market Share Analysis
A combination of visual indicators and rankings highlights the proportion of premium volume generated by each intermediary.
Why it matters:
Organizations can immediately identify top-performing partners, measure market contribution, and monitor changes in intermediary influence over time.
Commission vs. Active Policies
This dual-axis visualization compares commission amounts with the number of active policies managed by each intermediary.
Why it matters:
It helps organizations determine whether portfolio growth is translating into sustainable revenue and highlights differences in profitability across distribution channels.
Sales Pipeline Visibility
A comparative chart presents the current opportunity value within the sales pipeline for each intermediary.
Why it matters:
Business teams can anticipate future production, identify high-potential partners, and allocate resources more effectively to maximize growth opportunities.
Active Policy Portfolio Ranking
Intermediaries are ranked according to the total premium value of their active policy portfolios.
Why it matters:
This provides a clear understanding of portfolio size, business significance, and the strategic importance of each intermediary relationship.
Paid Refunds vs. Claims Analysis
An integrated visualization compares paid refunds and claims amounts across intermediaries.
Why it matters:
Decision-makers gain deeper insight into portfolio performance and can better understand risk-related outcomes associated with each distribution partner.
Average Client Category
The dashboard calculates the average customer profile score based on the products and clients managed by each intermediary.
Why it matters:
Organizations can assess customer quality, identify concentration within specific segments, and better understand the composition of intermediary portfolios.
Claims Ratio Performance
A dedicated claims ratio visualization highlights loss performance by intermediary.
Why it matters:
This metric helps insurers identify partners with higher claims impact and supports strategic decisions regarding portfolio management and partnership development.
The Power of Microsoft Power BI Integration
The value of the Intermediary Comparison Dashboard extends beyond the KPIs themselves.
By leveraging Microsoft Power BI, users benefit from advanced analytical capabilities, including:
- Interactive cross-filtering between all visuals
- Drill-through navigation for deeper investigation
- Dynamic filtering by period, segment, or business criteria
- Role-based access and security
- Mobile-friendly access across devices
- Real-time insights and visualization updates
These capabilities transform data into actionable intelligence, enabling business users to move beyond reporting and into strategic decision-making.
A Practical Example
Consider an insurance company working with dozens of brokers across different regions.
Using the Intermediary Comparison Dashboard, the commercial team identifies a broker with a significantly larger sales pipeline than average but a relatively small current market share.
This insight suggests untapped growth potential.
The company can then proactively support the intermediary through targeted campaigns, additional enablement programs, or closer commercial engagement.
At the same time, claims ratio analysis may reveal another intermediary with a higher-than-average loss ratio, prompting further investigation into portfolio quality and risk management practices.
Without a centralized analytical view, these opportunities and risks could remain hidden.
Turning Data into Better Business Decisions
Successful intermediary management requires visibility, consistency, and actionable insights.
The Intermediary Comparison Dashboard represents a major step forward in the analytical capabilities of myCRM for Insurance, enabling insurers to compare intermediary performance, identify growth opportunities, optimize partnerships, and improve strategic decision-making.
As myCRM for Insurance continues to evolve, additional analytics capabilities and deeper Power BI integrations will further empower insurance organizations to make data-driven decisions with confidence.
Ready to Gain Greater Visibility into Your Distribution Network?
Discover how myCRM for Insurance can help your organization analyze intermediary performance, strengthen partner relationships, and unlock new growth opportunities through advanced analytics.
Contact our team today to schedule a personalized demonstration.
More Articles
Browse our articles and learn more about myCRM for Insurance